PET imaging shows different brain activity in people taking methadone or buprenorphine for opioid use disorder (OUD), according to a presentation at the recent Society of Nuclear Medicine and Molecular Imaging annual meeting.
Jacob Dubroff, MD, PhD, of the University of Pennsylvania in Philadelphia, provided evidence using carbon-11 (C-11) carfentanil PET that individual buprenorphine-treated patients have lower mu-opioid receptor activity across all brain regions than either methadone-treated patients or healthy controls.
The findings “improve our understanding of how best to maintain abstinence from illicit opioids and improve clinical outcomes,” Dubroff said, in a June 11 session in Toronto.
The mu-opioid receptor (MOR) is responsible for the major effects of all opiates and is a critical target for medication-assisted treatment. Buprenorphine and methadone trigger MOR and are used to reduce withdrawal symptoms from opiates like fentanyl, Dubroff explained.
C-11 carfentanil is a PET radiotracer that binds to MOR and visualizes its distribution in the brain. Two prior PET studies have shown dose-related reductions in MOR availability by buprenorphine, yet no studies have explored the effects of methadone on the receptor in patients maintained on the drug, he noted.
Dubroff and colleagues enrolled 15 participants between the ages of 18 and 50: 11 healthy controls with no history of a drug use disorder, three OUD patients maintained on methadone and one patient maintained on buprenorphine. They tracked serum levels of methadone or buprenorphine for the OUD subjects.
All subjects underwent 90 minute dynamic whole-body PET scans using a dedicated research scanner called PennPET Explorer. Prior to PET scanning, subjects also underwent T1-weighted MRI brain imaging to create templates to segment the PET brain data into 10 regions of interest.
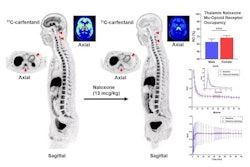
 C-11 carfentanil PET brain images in the sagittal plane (left column) and multiple transaxial planes (2nd through 4th columns) are shown on the left side. Red arrows indicate brain stem (1st column), amygdala (2nd column), and ventral tegmentum (3rd column). Experimental group descriptions are shown on the right (top) along with Logan distribution volume ratio (DVR) volumes of interest (VOI) means and coefficient of variances (CV) with percent change compared with the healthy control (HC) mean (%Diff). P-values (Mann-Whitney U test) are also provided. The VOI DVRs are plotted in the bottom right graph.Image and caption courtesy of Jacob Dubroff, MD, PhD.
According to the results, the individual buprenorphine-treated patient showed lower MOR availability across all brain regions than either the methadone-treated patients or the healthy controls. In contrast, methadone-treated subjects had lower MOR availability than healthy controls only in the ventral tegmentum, brain stem, and amygdala.
The significance of the study is that it shows for the first time the relationship between methadone and receptor availability in stable patients, Dubroff said.
“Just showing that relationship has not been done before,” he said.
Ultimately, the data could be useful for developing strategies to tailor methadone or buprenorphine to individual patients, he said. Sets of serial PET scans would provide a greater understanding toward that, yet are difficult to obtain in this patient group, Dubroff noted.
“Further studies that include evaluation of the clinical correlates of these findings are needed to understand these differences and identify opportunities for individualized [treatments] in patients with OUD,” he concluded.